Thickness-Tunable Zoology of Magnetic Spin Txtures Observed in Fe5GeTe2
The family of two-dimensional (2D) van der Waals (vdW) materials provides a playground for tuning structural and magnetic interactions to create a wide variety of… Read More »Thickness-Tunable Zoology of Magnetic Spin Txtures Observed in Fe5GeTe2

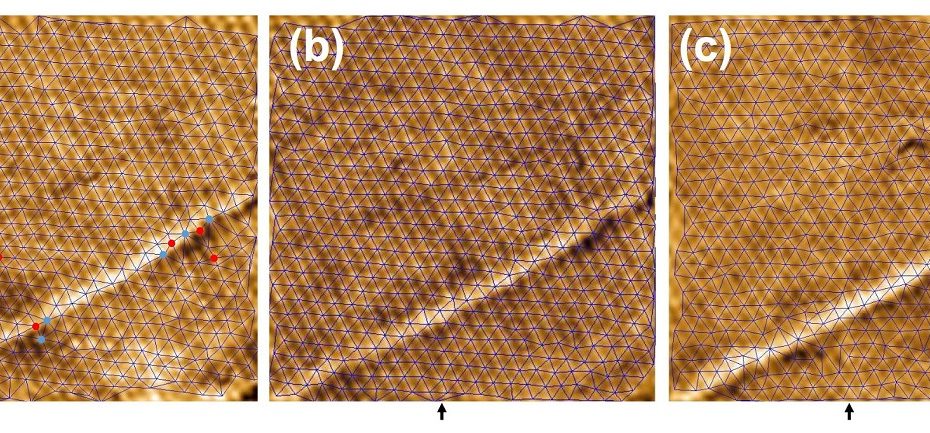
![Supplementary Figure 1 a – d from “Macroscopic manifestation of domain-wall magnetism and magnetoelectric effect in a Néel-type skyrmion host” by K. Geirhos et al: Typical ferroelectric do-main pattern observed on the (001) cleaved GaV4Se8 crystal surface atT=10 K. a, The topography is characterized by stripes roughly parallel to the [110] axis and folds parallel to the [010] axis. The latter originate in the differently oriented distortion of the ferroelastic domains. The color scale corresponds to the z-displacement of the tip. b ,In the dissipation channel of the nc-AFM every second domain appears bright. For the non-magnetic tip the dissipation originates from electric interactions. The dissipated power is indicated by the color scale. Please have a look at the full article to view the full supplementary figure. NANOSENSORS Platinum Silicide PtSi-FM AFM probes were used for the imaging.](https://www.nanosensors.com/blog/wp-content/uploads/2022/11/Supplementary-Figure-1-a-–-d-from-Macroscopic-manifestation-of-domain-wall-magnetism-and-magnetoelectric-effect-in-a-Neel-type-skyrmion-host-by-K-Geirhos-et-al-PtSi-FM-2-766x620.jpg)
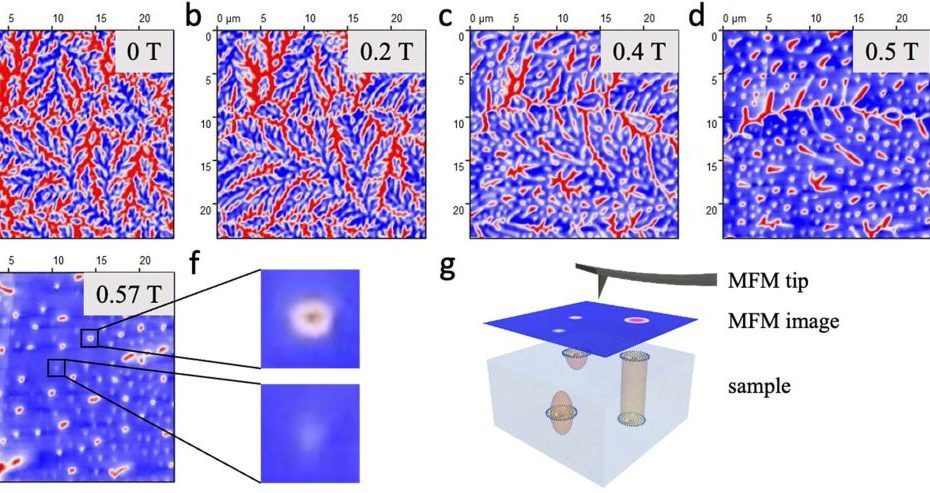
![Figure 2 from “Electric-field-driven non-volatile multi-state switching of individual skyrmions in a multiferroic heterostructure” by Yadong Wang et al.: Electric-field-induced switching of individual skyrmion. The transferred average strain εave and corresponding magnetic domain evolution processes in the d ~ 350 nm a [Pt/Co/Ta]12 and b [Pt/Co/Ta]8 nano-dots in a cycle of E ranging from +10 to −10 kV cm−1. Positive εave (red dots) represents tensile strain while negative εave (blue dots) represents compressive strain. μ0H represents the external magnetic field except that from the MFM tip and here μ0H is equal to be 0 mT. The inset of b illustrates the spin texture of the magnetic domain that is encompassed by the red box. The stripe domain enclosed by the black box shows the initial state of the magnetic domain evolution path. The gray dots represent the corresponding electric field for the MFM images. The MFM contrast represents the MFM tip resonant frequency shift (Δf). The scale bar represents 250 nm. NANOSENSORS™ PPP-LM-MFMR low moment magnetic AFM probes were used](https://www.nanosensors.com/blog/wp-content/uploads/2022/11/figure-2-from-Electric-field-driven-non-volatile-multi-state-switching-of-individual-skyrmions-in-a-multiferroic-heterostructure-by-Yadong-Wang-et-al-2020-NANOSENSORS-PPP-LM-MFMR-2-930x547.jpg)