Skip to content

原子力显微镜

Comparative analysis of frictional behavior and mechanism of molybdenum ditelluride with different structures

Figure 3 from “Comparative analysis of frictional behavior and mechanism of molybdenum ditelluride with different structures” by Lina Zhang et al.: Atomic-scale friction maps of MoTe 2. (a) Mapping of friction signal of 1T′-MoTe 2. (b) Reciprocal lattice obtained by 2D FFT on (a). (c) Atomic-level stick–slip map obtained by FFT filtering of (a). (d) Unit cell structure of 1T′-MoTe 2. (e) Friction profile extracted along the blue dashed line in (c). (f) Mapping of friction signal of 2H-MoTe 2 . (g) Reciprocal lattice obtained by 2D FFT on (f). (h) Atomic-level stick–slip map obtained by FFT filtering of (f). (i) Unit cell structure of 2H-MoTe2. (j) Friction profile extracted along the blue dashed line in (h). NANOSENSORS PointProbe Plus PPP-LFMR AFM probes were used.

Two-dimensional (2D) transition metal dichalcogenides (TMDCs) have layered structures with excellent tribological properties. * Since the energy difference between hexagonal-molybdenum ditelluride (2H-MoTe2) and distorted octahedral-molybdenum… Read More »Comparative analysis of frictional behavior and mechanism of molybdenum ditelluride with different structures

First day @Arablab

Meet our CEO at Arablab 2022 and discuss the many applications that are possible using our AFM probes for Atomic Force Microscopy

Meet our CEO @Arablab 2022 in Dubai this week and discuss the many applications that are possible using our #AFMprobes for #AtomicForceMicroscopy

Monitoring SARS-CoV-2 Surrogate TGEV Individual Virions Structure Survival under Harsh Physicochemical Environments

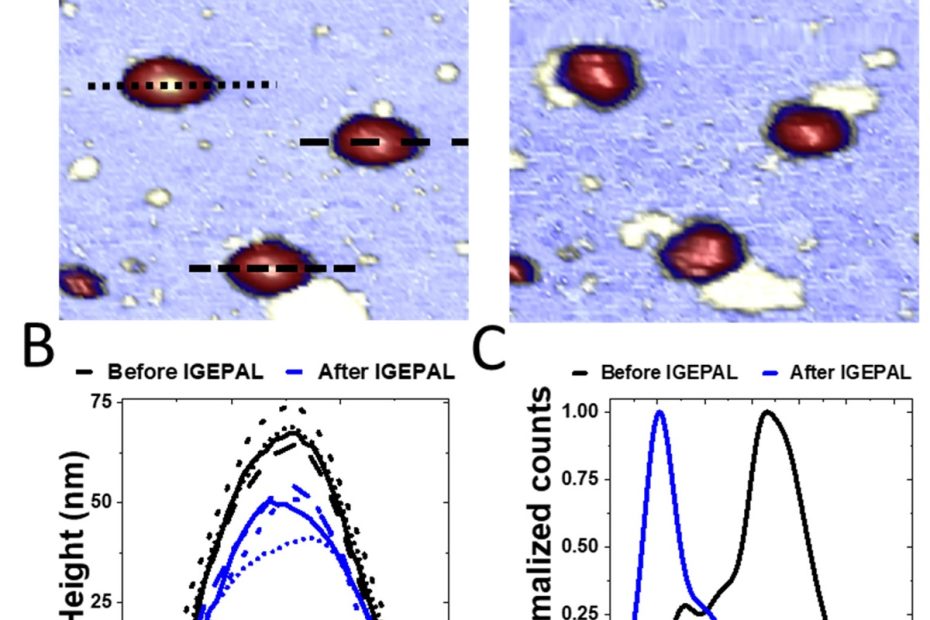
Figure 3 from “Monitoring SARS-CoV-2 Surrogate TGEV Individual Virions Structure Survival under Harsh Physicochemical Environments” by Miguel Cantero et al.: Treatment of TGEV with IGEPAL 0.2% (A). Topographical images before (left) and after (right) IGEPAL treatment (B). Profiles traced over the particles before (black) and after (blue) the treatment. The time interval between images was ~30 s (C). Height distribution of TGEV particles before (black) and after (blue) treatment (n = 103). Counts taken from the distribution curve were normalized for comparison. The peak shifts from the value of the intact particle height to the height of the cores. NANOSENSORS uniqprobe qp-BioAC AFM probes were used for the atomic force microscopy measurements.

Successful airborne transmission of coronaviruses through fluid microdroplets requires a virion structure that must withstand harsh natural conditions. * Because of the strict biosafety requirements… Read More »Monitoring SARS-CoV-2 Surrogate TGEV Individual Virions Structure Survival under Harsh Physicochemical Environments